News Parser
14 Oct 2019 · Auke Roorda
This post explains the process of the News Parser project.
Last update at: 12:19, 14 Oct 2019
The goal
To create a tool that gives insight in the (un)intended bias that news publishers have when writing down their interpretation of events, be it left or right, liberal or conservative. The main tool will be highlighting key differences between articles about the same event, to give users an immediate overview. Common ground between the content of articles should not be ignored either, as this can be an indicator of confidence. It is important to show people the effect of their filter bubble, their (implicit) selection of news sources. Especially with political news it is important to see the different portrayal of events.
Approach
This is an overview of the current approach. We are still some distance from our goal. Feedback is mostly sought for all but the scraping step. Feel free to contact me at auke@roorda.dev.
Scraping
To gather articles, we run our scraper periodically. It parses the RSS feeds at the given URLs. Each publishers website has to be scraped in its own way, as the layout can be different, to get the right content. Sometimes a publisher has more than a single layout for articles. We think that we should store more fields than we have now, fields such as the retrieval date of the article. Currently we store the following fields in an SQLite3 database:
| Type | Name | Description |
|---|---|---|
int |
id |
Incrementing primary key for database |
text |
src |
The publishers name |
text |
url |
The URL from which the article was downloaded |
text |
time |
The time at which the article was released |
int |
unixtime |
The UNIX timestamp of the time the article was released |
text |
title |
Title of the article |
text |
content |
Body of the article |
Some problems we ran into:
- Varying RSS formats: A decent portion of publishers use a Google Feedburner RSS format, which always contains the same elements. However, there are also plenty who have their own structured XML, requiring tailored parsing.
- URL Redirects: Some RSS feeds contain a shortened URL linking to the article. We are using the URL found in the RSS feed to check whether an article has been scraped. This means the database contains shortened, non-discriptive, and maybe even non-permanent URLs to articles.
- Different site layout: Most sites have a different layout, requiring a modified scraper to download articles.
Preparation stage
Having the articles, our next step is to prepare them for feature extraction. To start off, we normalize the words, replacing words with their stem, using lemmas (both Dutch and English) found at the Max Planck Institute for Psycholinguistics. These lemmas are of the following format (word\stem):
abaci\abacus
aback\aback
abacus\abacus
abacuses\abacus
abaft\abaft
abandon\abandon
abandoned\abandoned
abandoned\abandon
abandoning\abandon
We also use a small ignore set, which contains a list of words that are to be ignored, which looks like this:
the be to of and a in that have I it for
not on with he as you do at this but his
by from they we
It is based on the 25 most occuring words in the English language. Again, there are some considerations about using these lemmas and ignore sets: they are both places where bias can be introduced, considering the tf-idf statistic used later.
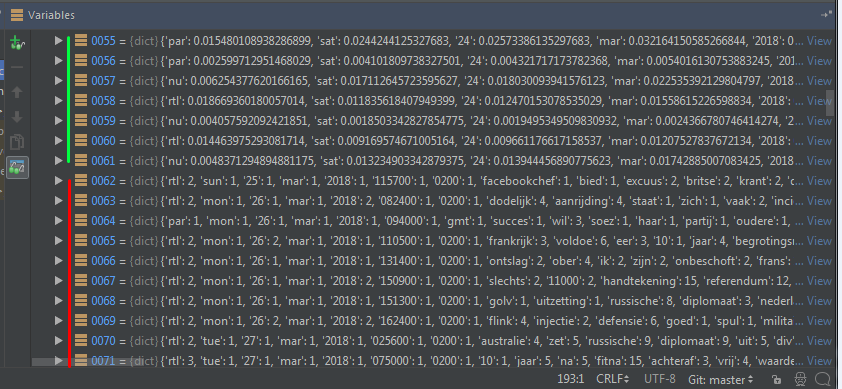
Feature extraction
We start by creating a histogram for each article, counting the occorences of
the normalized words. For longer articles, a higher number of occurences can be
expected compared to shorter articles. Also, some words might occur often, but
are not of importance to the information that the article conveys, words such as
‘the’, since they are too general. Most of these words are filtered out using
the ignore set, but some will still come through. We use the
tf-idf statistic to normalize
this histogram. The term frequency tf is calculated by counting the occurences
of the word in the article, and dividing it by the total number of words in the
article. The idf, inverse document frequency, is calculated by taking the
logarithm of the number of articles over the number of articles in which the
term occurs. There are variations of this statistic to be explored. There are
still some things we have to consider, such as:
- pairs of words (“Donald Trump” or “Donald Duck”).
- word-vectors as discussed in this blog post. A very interesting read, and something that could give insight into the polarisation and objectivity of the words used in an article.
Distance function
We are computing the distance between two articles by comparing their
tf-idf-normalized histograms, or feature vectors. We chose to use the
cosine similarity measure.
Two equal vectors have a cosine similarity of 1, two perpendicular vectors have
a cosine similarity of 0, and angles greater than 90 degrees (which are not
possible in our dataset), have a negative value, up to -1. Calculating the
cosine similarity requires equal domains, so we take the union of the domains,
adding each feature in A, that is not in B, to the vector of B, with a value of
0, and do the same vice versa.
Grouping/clustering
First we compute a 2d matrix by calculating the distance between each pair of
articles. Then, using a similarity-treshold value, we determine which articles
are similar (i.e. those who have a cosine similarity higher than the treshold).
This results in a matrix of binary values, describing the pair-wise similarity
between articles. For now we don’t cluster particularly well; we just remove
groups that are irrelevant. Our cleanup approach is as follows:
- For every row, we create a group, containing the article that the row is based on, and every article that is deemed similar.
- We then take the set of this group of groups, to filter out any exact duplicate groups
- We remove groups with just a single article
- We remove any group that is contained in (is a subset of) another group
This results in a lot of similar groups, that have so far been used to gain
a little insight in how groups could be merged. We have shortly tried to use
Warshall’s Algorithm to compute the transitive closure of the group. This
closure states that, if a relates to b (read: a is similar to b) and b relates
to c, then also a relates to c. This has to be true for any a, b, c in the
relation (or matrix). This resulted in very large groups, which had large
within-cluster distances.
Comparing all articles with all other articles scales very badly (n^2). We could
consider comparing to only the most recent M articles, instead of the whole
database, but this has the downside that long-lasting chain of events might not
be linked together anymore.
Intra-cluster parsing
This is something we are not yet doing, but have been building towards. We would like to convert group of articles that makes up each event into something insightful. This will be heavily based on natural language processing concepts, and this is something we are not very familiar with. We are looking to process event-groups, to be able to find (and later highlight) dissimilarities between the content, and highlighting outliers and common grounds. Maybe sentiment-analysis and objectivity/subjectivity statistics could be calculated for the individual articles in this event, or for the total event. Fact extraction and relation extraction can be used to show the difference in information that is shown in articles. A very daunting task would be merging the articles into one, with meta-data about each sentence (which publishers ‘agree’, how many, etc.). Something that might be easier, is recreating a timeline of sub-events that make up the story of the cluster (and highlighting discrepancies with the source articles).
Presentation/interface
To interface is an important part, as it tells users how to work with the tool. Right now there is not much metadata about articles or article groups to display; no extracted facts/relations, no sentiment analysis or objectivity scores. We show the relevant news articles next to eachother, grouped by their release date. This gives a timeline of the event, but that is just it so far. This is too much reading to be useful, so we are aiming to condense the group of articles into a more insightful overview.
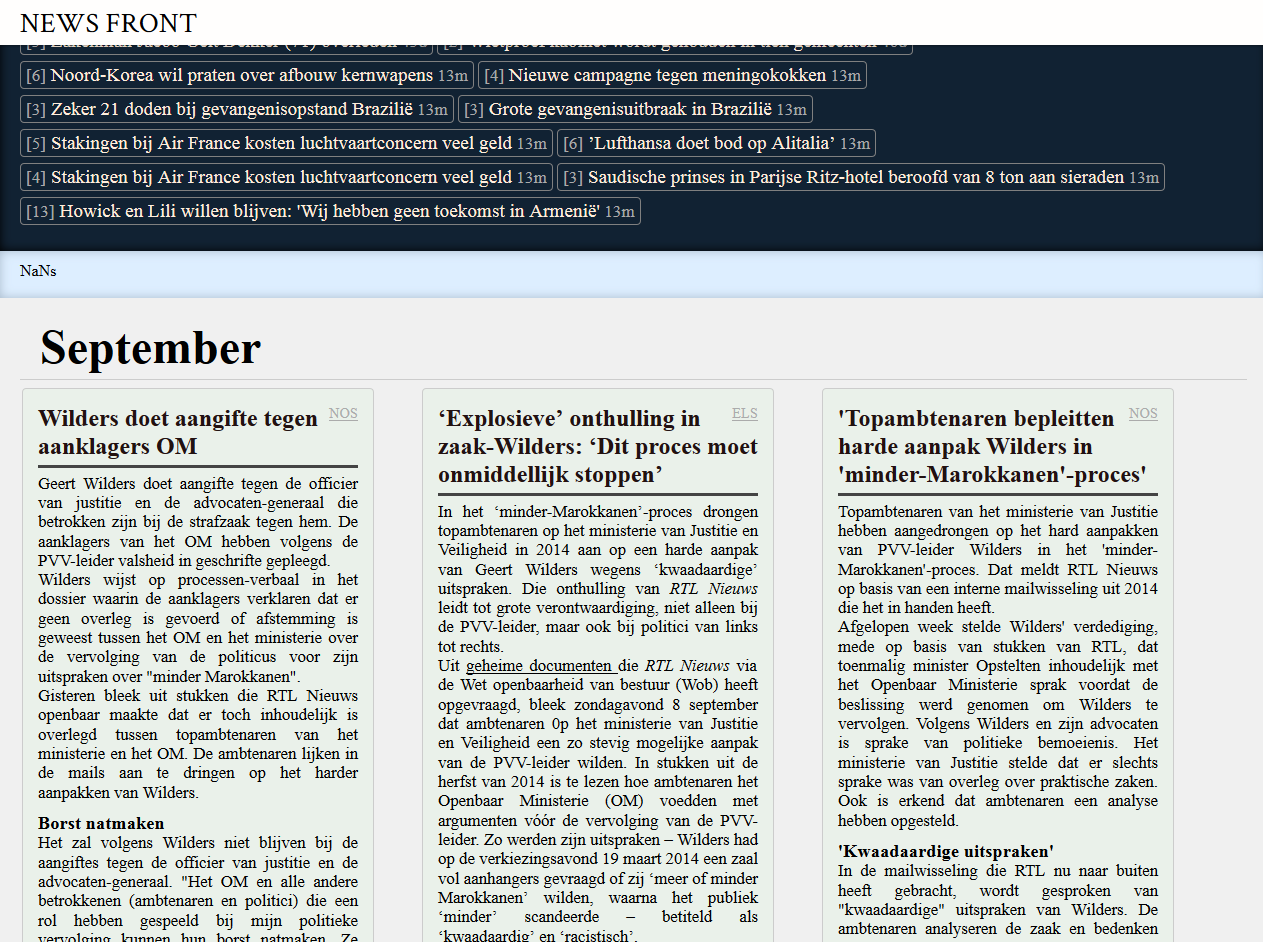
The interface is still very lacking, giving no insight in shared features of the articles, no insight in shared facts stated in the articles, no insight in content-wise outliers.